
Standard Celeration Charts
The COVID-19 pandemic is the oft-cited boogeyman of the education world these days. Certainly, it marked a watershed moment not just in education but for the world. Many people turned to baking their own bread or returning to the land. It was during this upheaval, and following eight weeks of fighting the virus myself, that I took a deep dive into reading fluency.
What I discovered was, for me, a revolutionary tool––the standard celeration chart. Ogden Lindlsey, a notable psychologist, developed this semi-logarithmic line chart to analyze how a given behavior changes over time. In many ways, it’s a narrative form of data. When applied to reading instruction, one can take reading and foundational reading skills and examine them as sets of behaviors. Essentially, the chart is both a fluency measurement tool for each skill, and a means of making very fine adjustments in real time to an intervention.
I work primarily with dyslexic students, and this discovery changed everything about my practice. For years, I’ve been using Siegfried Engelmann’s Direct Instruction materials, and during the pandemic, I learned the Maloney Method, which combines DI and precision teaching from the standard charts. I ended up seeing fourteen students in individual sessions over the course of two years, and the precision teaching with the standard celeration charts became a key part of that work.
If you are, like me, more of a creative type than a graphing fanatic, you might initially balk at the chart. It is a fairly complex looking document. However, I’ve come to rely on my charts because I can show a student’s learning journey in data form. It’s also an incredibly sensitive measure that allows me to break a skill down pretty far…even to ten to twelve second timings.
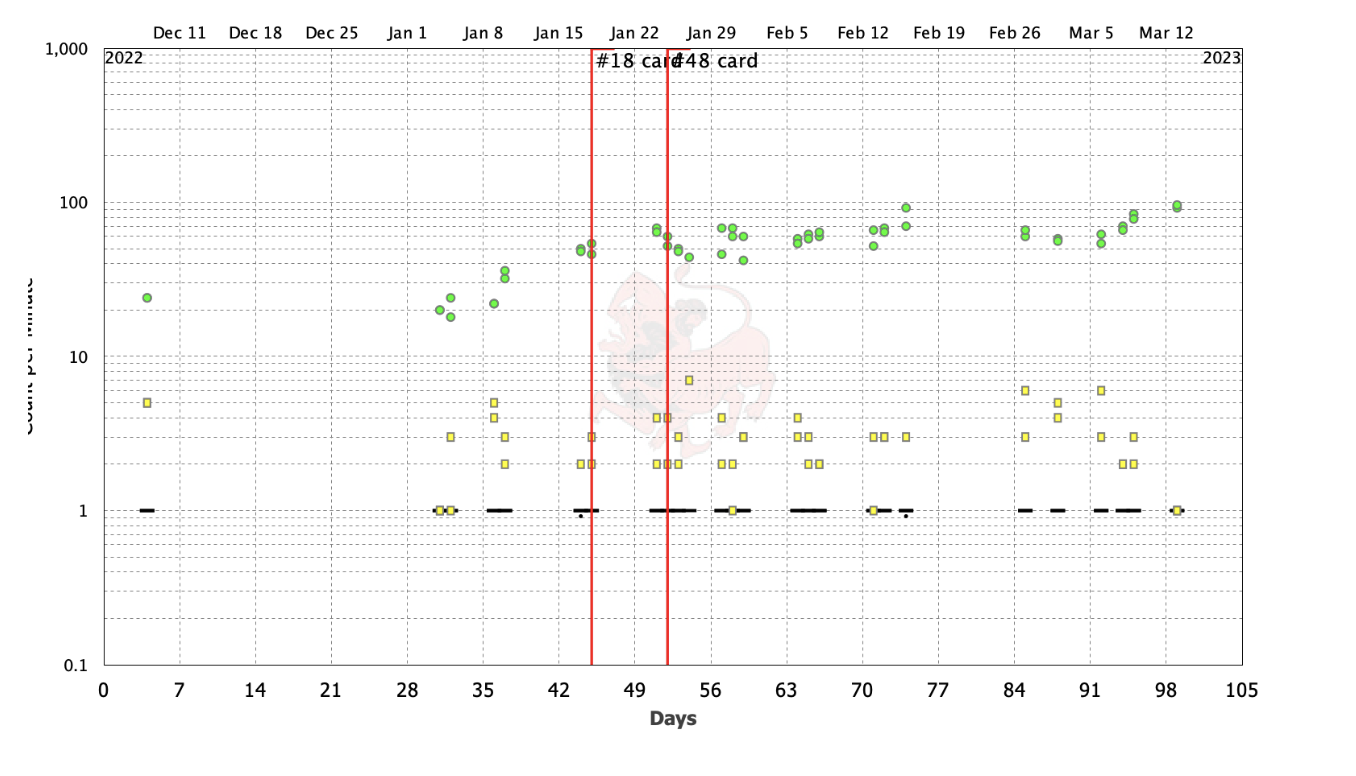
In the above chart sample, I was working on the skill of vowel fluency using Jean Tucker’s Spell of Language vowel assembly. I do two timings per session, represented by the green data points. The error rate is in yellow, and the red phase shifts show when I adjust. The y-axis should be labelled “count per minute.”
In this case, I went from using a vowel chart to Jean’s eighteen card pack of vowel sounds, followed by forty-eight cards––which contain alternate vowel spellings. The end goal is for the student to produce one-hundred sounds in one minute. I measure the vowel sounds with thirty second timings and double the number produced, assuming that the same rate will hold over the next thirty seconds. essentially the student needs to say the entire forty-eight card pack as well as repeat at least two sounds. The chart shows the skill in terms that demonstrate growth in terms of rate over time. In this case the skill continued to evolve to the point the error rate reduced and the rate remained relatively stable over a period of weeks. There’s still a little bit of work left to do, but the chart is now showing me that the vowel system has improved tremendously over a few months and that I can start to wind down on this skill. I will wait until the error rate dips closer to zero errors, but it will likely be a skill that I start to wind down sooner rather than later.

By March, it’s clear that we were able to reach the desired speed (between 95-100 sounds in 1 min). The error rate is still about two to three errors each session. But when we compare these two celeration charts, I can say that this student has improved this skill. The value of this data for educators and for interventionists is invaluable because it gives me a granular look at each skill and lets me know when I can evolve the instruction. This data, for example, is telling me that we need to keep working on the vowels, but that the vowel system is mostly fluent at this point.
It’s worthwhile to learn how to use this tool to monitor student progress and to inform instruction. There are programs that can generate digital charts and even some that can program in the data for you. There are many ways this chart can be used, and it is highly adaptable. You can measure almost anything. I’ve seen some precision teachers who can build up a wide variety of cognitive and behavioral skills as well as academic skills. There are limits to this tool, as there are with every tool, but it is a powerful option for building up our students’ skills.